What are harmful algal blooms?
Algal blooms occur naturally with phytoplankton or microalgae providing food for aquatic organisms. However, some algal blooms are harmful. Harmful algal blooms can be divided into three groups. The first group comprises species that are normally harmless. However, when these species occur in dense blooms, they can cause fish and invertebrate kills because dissolved oxygen is consumed when the bloom decomposes (e.g. some cyanobacteria, diatoms, and macroalgae). The second group of harmful algal species produces potent toxins that can cause illness or death in grazers or further up the food chain, due to the effects of bioaccumulation (e.g. toxic cyanobacteria and dinoflagellates). The third group of harmful algae includes species that are not toxic, but that have physical attributes such as spines which can irritate and damage gills and tissues of fish (e.g. some diatoms, dinoflagellates and raphidophytes)1.
Harmful algal species are usually naturally occurring algae that for some reason reach high enough concentrations to be a nuisance e.g. create smells, kill fish and animals, or be a public health threat. Harmful algal species can also be exotic taxa introduced to coastal waterways with ship ballast water or through biofouling or shellfish translocation. Algal blooms are a serious coastal issue with economic consequences for fisheries stocks and sales, shellfish sales, human and animal health and recreation. The frequency of algal blooms is an important indicator for State of the Environment reporting2, and was adopted as one determinant of ecosystem integrity during the National Land and Water Resources Audit.
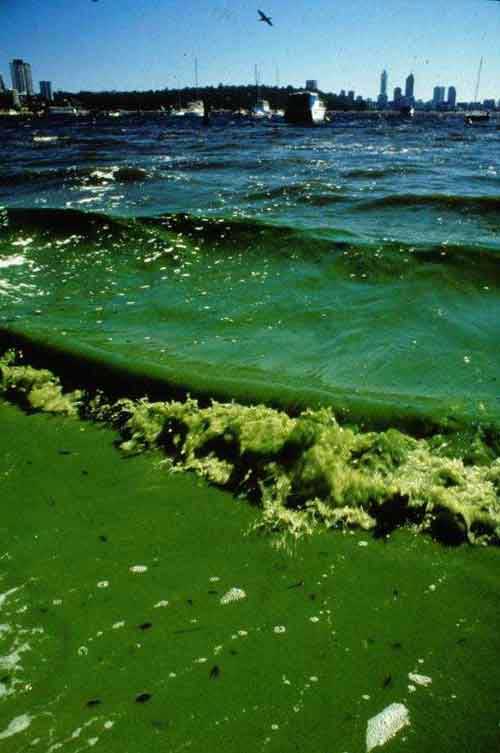
Photo 1. Microcystis bloom in Matilda Bay, Swan-Canning Estuary, Western Australia. Photo by Dennis Sarson (February 2000). Used with permission of the Waters and Rivers Commission of Western Australia.
Significance of algal blooms
Blooms can have several detrimental effects on aquatic ecosystems and degrade the recreational amenity of beaches, lakes and estuaries. Blooms can be composed of species that are toxic and irritate the skin of humans (public health nuisances) or be toxic to fish and other aquatic life. Blooms give rise to large fluctuations in water column dissolved oxygen concentrations and pH, and only species with broad dissolved oxygen and pH tolerances may survive. Blooms are also a cause of turbidity. As such, they can block the penetration of sunlight to the seafloor, reducing both seagrass areas and the animals that rely on seagrasses for food and shelter (e.g. turtles and dugongs). In addition, when the microalgae decays it releases waste products and bioavailable nitrogen, produces offensive odours and consumes large amounts of dissolved oxygen. Anoxic or hypoxic conditions may develop afterwards in some cases. Aquaculture production can be severely impacted by the presence of algal blooms, both from direct mortality of fish and shellfish due to reduced dissolved oxygen availability and because of the potential bioaccumulation of toxins if filter feeding organisms are being grown.
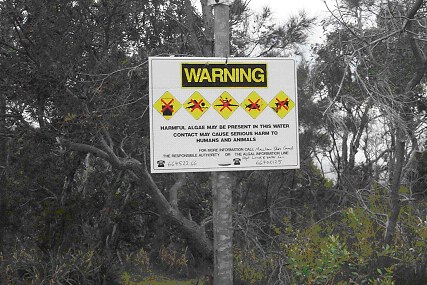
Photo 2. Sign warning of the dangers of harmful algae.
What causes algal blooms?
Phytoplankton blooms in coastal waters have been linked to light availability3, water temperature4, salinity 56, nutrient availability, forms78 and supply ratios8, trace elements 9, grazing rates and selectivity, pH10 and benthic carbon dioxide flux11. Interactions between all of these listed factors are also important. When certain physical and chemical conditions are met, specific anatomical or metabolic adaptations give certain species a competitive advantage, and allow them to proliferate and create a bloom.
For example:
- Some dinoflagellates and blue-green algae (cyanobacteria) can move up and down the water column using their opposing pair of flagella in the case of dinoflagellates, and by the expansion and contraction of gas vacuoles and stored weight of carbohydrates (i.e. ballast) in the case of blue-green algae. This allows them to be in the best position to obtain nutrients (often at night) and light (usually during the day on the surface) and to avoid surface water currents that might move them to less favourable places in the waterbody.
- Increased frequency and severity of blooms of some algal species is often symptomatic of excessive inputs of land-based nutrients (leading to eutrophication) [22]. Some point-sources of nutrients to coastal waterways are coastal discharges, including outfalls from industry, wastes from aquaculture operations and sewage discharged from yachts, boats & ships. The risk imposed by point-sources of nutrients in coastal waterways is higher in areas with large population densities or with a significant tourism, and can be estimated by the number of point-sources per unit area of coastline. Non-point sources of nutrients from intensive agriculture in catchments and urban stormwater are often larger and more difficult to control. Typically the species that proliferate under such conditions are able to outcompete other species in their ability to take up freely available nutrient forms (e.g. nitrate vs. ammonium, phosphate, DON, particulate nutrients, silicate) [22].
- Iron is an important trace element for blue-green algae because it is an important constituent of the enzyme nitrogenase involved in nitrogen fixation. Airborne dust and acid leachate from acid sulphate soils12 are potential sources of the trace element iron. Iron is also transported from catchments to estuaries with suspended sediment, and such loads are enhanced by land clearing and during periods of heavy rainfall13. Dissolved iron availability increases as salinity14, pH 15 and oxygen status (redox)15 decrease.
- Dissolved oxygen and salinity changes are often required to break the dormancy of some dinoflagellate cysts13. Consequently, dormant dinoflagellate cysts can be stimulated to germinate by dredging13, saltwater intrusion16 and tidal exchange.
- Phytoplankton growth is also affected by hydrodynamic features of coastal waterways that control advection and mixing rates166. Tidal currents in mesotidal and macrotidal waterways (mean tidal range >2m) discourage blooms because they mix the water column and reduce the residence time of algae in the photic zone (i.e. surface zone of light penetration)17. Tidal mixing can also cause fine sediment to be resuspended, and the resulting turbidity reduces light available for photosynthesis173. In comparison, stratification that develops under microtidal conditions (e.g. mean tidal range <2m) can encourage blooms because it deepens the photic zone16 and reduces turbulence18. At the most basic level, bloom formation requires that net algal growth rate exceeds hydraulic residence time19.
- Reduced freshwater inflows to coastal waterways due to human intervention is likely to increase the incidence of bloom-forming species620. This is because large amounts of freshwater discharge usually indicate high flushing rates and lower the residence times for different species to grow20. Increased freshwater flow is also likely to enhance the ventilation of bottom waters20.
Coastal waterways most susceptible to algal blooms
Blooms are most common if warm, calm and stratified conditions occur after rainfall events in waterbodies, estuaries and coastal systems that are subject to elevated nutrient loads (see below)13. These conditions are often found in enclosed bays and microtidal systems (mean tidal range <2m). Microtidal waterways often (but not always) fall into wave-dominated geomorphic classifications (e.g. deltas, estuaries and coastal lagoons and strandplains). Blooms seldom occur in well-flushed waterways or in mesotidal or macrotidal coastal systems because freshwater inflows dilute nutrients and cell densities, and because tidal mixing turbidity and reduces the length of time that algae can be in the photic zone. Macrotidal waterways usually fall into usually tide-dominated geomorphic classifications (e.g. deltas, estuaries and tidal creeks).
Considerations for measurement and interpretation
Algal blooms sometimes appear as scum floating on the water surface and sometimes they appear as greenish, brownish (“brown tides”) or reddish (“red tides”) colourations of the water. However, concentrations of algae need to be measured if the presence of an algal bloom is suspected. Blooms can also be classified according to their potential and actual toxicity to humans and wildlife. This requires the identification of species. Monitoring of nutrient levels, water temperature and chlorophyll a concentrations may be of use for early detection and warning. Chlorophyll a concentrations, in particular, are a good indicator of the biomass of algae, and can be monitored using remote sensing techniques. However, the cell concentrations at which harmful algae can become toxic is very species specific. With some taxa, harmful levels can be reached when concentrations are only 500 cells per litre. Others have lower counts and others higher. The size of toxic blue-green algal cells are an important consideration as bigger cells contain more toxins than smaller cells. This has led to a biovolume approach rather than a concentration approach for management. For example, the alert levels at which freshwater blue green algae concentrations are considered harmful are currently being adapted from a concentration (15,000 to 20,000 cells per litre) to a biovolume (2 ml cell volume per litre) because of the influence of size on the amount of toxins in each cell. Another important thing to consider is the fact that the types of toxins and the concentrations of toxins vary between species.
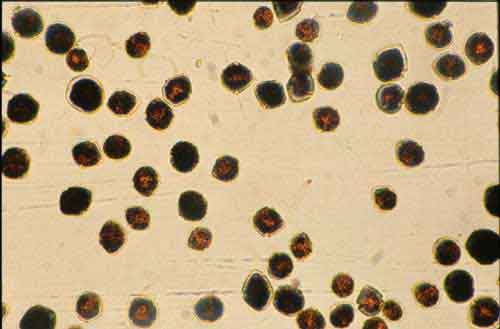
Photo 3. Scripsiella dinoflagellate. Photo by Wassele Hosja. Used with permission of the Waters and Rivers Commission of Western Australia.
Existing information and data
Major research institutions, universities and government (local and state) agencies gather data on algal blooms for specific research studies. Measurements of chlorophyll a concentrations are undertaken in many Australian estuaries as part of routine water quality monitoring. However, there are no ongoing systematic monitoring programs across subregions or on larger scales that compare and track changes over time except perhaps for the State of the Environment that occurs every five years. Further details can be obtained on eutrophication and algal blooms from National Eutrophication Management Program. The relationships between chlorophyll a concentrations and nutrient loads in different types of coastal waterways can be explored in the Simple Estuarine Response Models (SERM) developed by CSIRO.
More information on nutrients (changed from natural).
Key questions
Why are algal blooms often dominated by just one species that has reached incredibly high numbers? What ecological and physiological conditions let one species dominate to such an extent that what is essentially a monoculture becomes established? How do you detect or determine harmful species?
Author
Tom Rose, WA Waters and Rivers Commission
Contributors
Naomi Parker, National Oceans Office
David Rissik, NSW Land and Water Conservation
Ian Webster, CSIRO Land and Water
- Hallegraeff, G.M., A review of harmful algal blooms and their apparent increase. Phycologia 32, 79-99. ↩
- Ward, T., Butler, E. and Hill, B. 1998. Environmental Indicators for National State of the Environment Reporting, Estuaries and the Sea, Commonwealth of Australia, pp. 81. ↩
- Cloern, J.E. 1987. Turbidity as a control on phytoplankton biomass and productivity in estuaries. Continental Shelf Research 7(11/12), 1367-1381. ↩ ↩
- Nielsen, M.V. 1996. Growth and chemical composition of the toxic dinaflagellate Gymnodinium galatheanum in relation to irradiance, temperature and salinity. Marine Ecology Progress Series 136, 205-211. ↩
- Kirst, G.O., 1995. Influence of salinity on algal ecosystems. In ‘Algae, Environment and Human Affairs’, (Eds. W. Wiessner, E. Schepf and C. Starr), pp. 123-42, Biopress: Bristol, England. v ↩
- Chan, T.U. and Hamilton, D.P. 2001. Effect of freshwater flow on the succession and biomass of phytoplankton in a seasonal estuary. Marine and Freshwater Research 52, 869-884. ↩ ↩ ↩
- Egge, J.K. and Asknes, D.L. 1992. Silicate as a regulating nutrient in phytoplankton competition. Marine Ecology Progress Series 38, 281-290. ↩
- Rost, B., Riebesell, U., and S. Burkhardt. 2003. Carbon acquisition of bloom-forming marine phytoplankton. Limnology and Oceanography 48(1), 55-67. ↩ ↩
- Gobler, C.J., Donat, J.R., Consolvo, J.A., Sanudo-Wilhelmy, S.A.2002. Physicochemical speciation of iron during coastal algal blooms. Marine Chemistry 77, 71-89. ↩
- Hinga, K.R. 2002. Effects of pH on coastal marine phytoplankton, Marine Ecology Progress Series 238, 281-300. ↩
- Webster, I.T., Parslow, J.S., Grayson, R.B., Molloy, R.P., Andrewartha, J., Sakov, P., Tan, K.S., Walker, J.S., and Wallace, B.B. (2001). Gippsland Lakes Environmental Study – Assessing options for improving water quality and ecological function. ↩
- see references in Cappo, M., Alongi, D.M., Williams, D, and N. Duke. 1995. A review and synthesis of Australian Fisheries Habitat Research: Major threats, issues and gaps in knowledge of coastal and marine fisheries habitats, Fisheries Research and Development Corporation. ↩
- Gunnars, A., Blomqvist, S., Johansson, P., and Andersson, C. 2002. Formation of Fe(III) oxyhydroxide colloids in freshwater and brackish seawater, with incorporation of phosphate and calcium. Geochimica et Cosmochimica Acta 66(5), 745-758. ↩ ↩ ↩ ↩
- Elder, J. F. 1988. Metal biogeochemistry in surface-water systems – A review of principles and concepts. US Geological Survey Circular 1013, pp. 43. ↩
- see references in Harris, G.P. 1999. Comparison of the biogeochemistry of lakes and estuaries: ecosystem process, functional groups, hysteresis effects and interactions between macro- and microbiology. Marine and Freshwater Research 50, 791-811. ↩ ↩
- Cloern, J.E. 1996. Phytoplankton bloom dynamics in coastal ecosystems: A review with some general lessons from sustained investigation of San Francisco Bay, California. Review of Geophysics 34(2), 127-168 ↩ ↩ ↩
- Monbet, Y. 1992. Control of phytoplankton biomass in estuaries: A comparative analysis of microtidal and macrotidal estuaries. Estuaries 15(4), 563-571. ↩ ↩
- Koseff, J.T., Holen, J.K., Monismith, S.G., and Cloern, J.E. 1993. Coupled effects of vertical mixing and benthic grazing on phytoplankton populations in shallow, turbid estuaries. Journal of Marine Research 51, 843-868. ↩
- Alpine, A.E. and Cloern, J.E. 1992. Trophic interactions and direct physical effects control phytoplankton biomass and production in an estuary. Limnology and Oceanography 37, 946-955. ↩
- Pitt, K., Kingsford, M., Rissik, D. and Koop, K. 2007. Jellyfish blooms that coincide with nutrient pulses can generate red tides. Australian Marine Sciences Association Marine Science in a Changing World conference, Melbourne, Australia, 9-13 July. ↩ ↩ ↩

